Every item your stores make, scored in seconds.
See what customers actually got, coach the shift that made it, and rank every store on one board.
The spec, scored at the cut table.
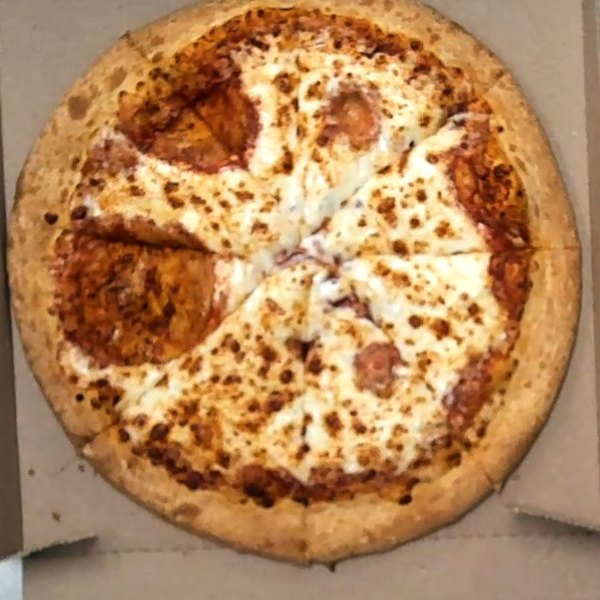
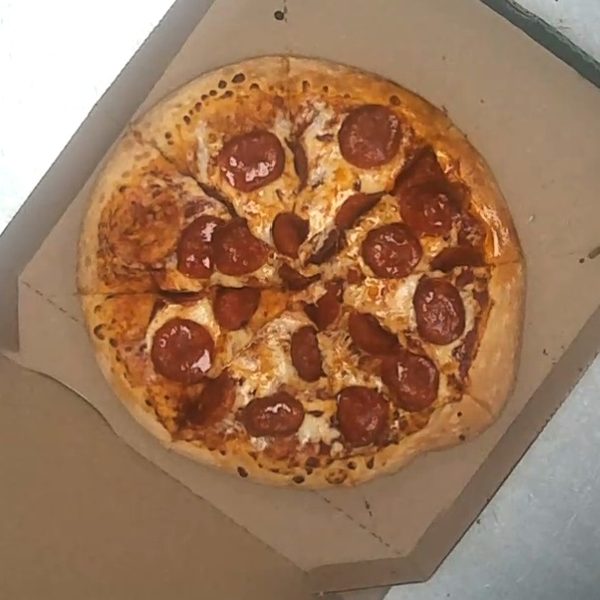
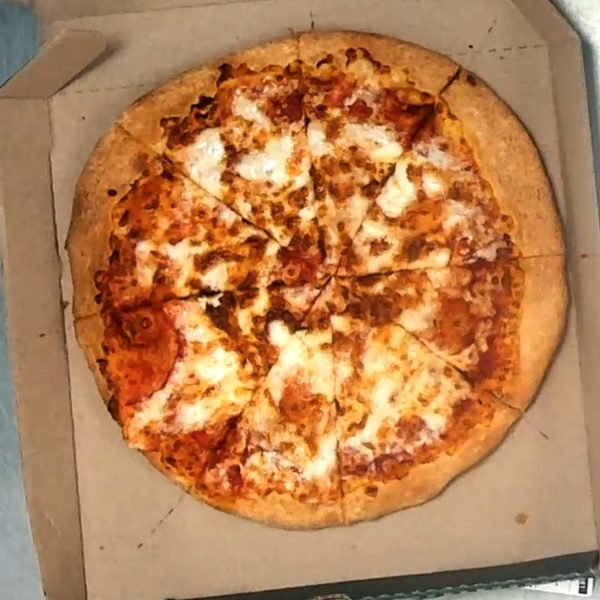
A camera over the cut table takes a picture of every item and scores it from 0 to 10 against your brand's own spec. Nothing to stop, no button to press, no POS integration. The picture and the score are on the dashboard in seconds.
- Size - the size the spec calls for
- Shape - round and evenly formed
- Bubbles - no dough bubbles
- Cheese distribution - even cheese, edge to edge
- Ingredient distribution - toppings placed and spread to spec
- Cut precision - clean, even cuts
- Crust - even all the way around
- Baking - not underbaked, not overbaked
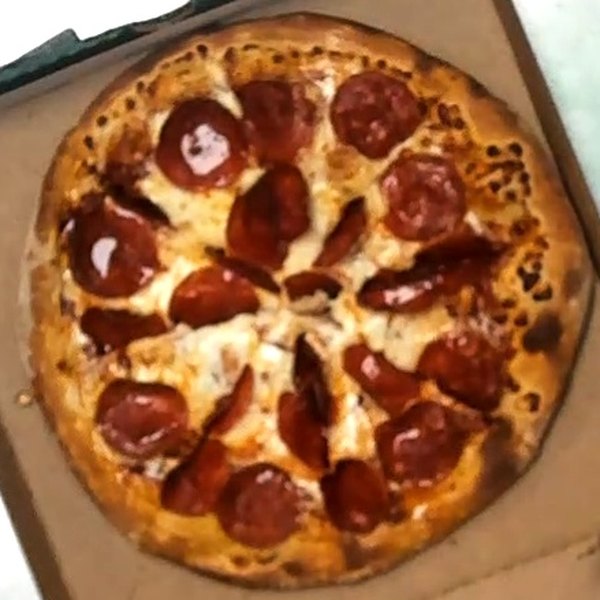
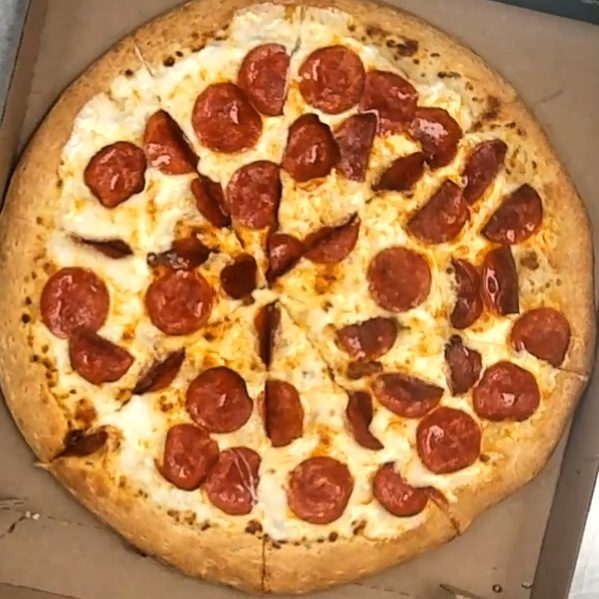
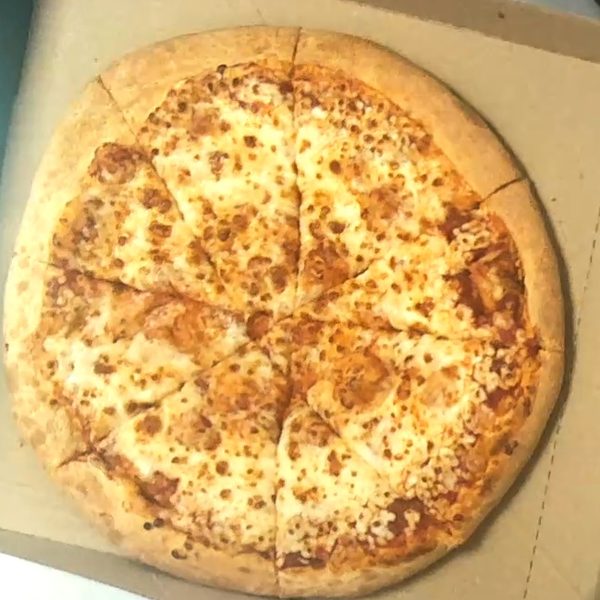
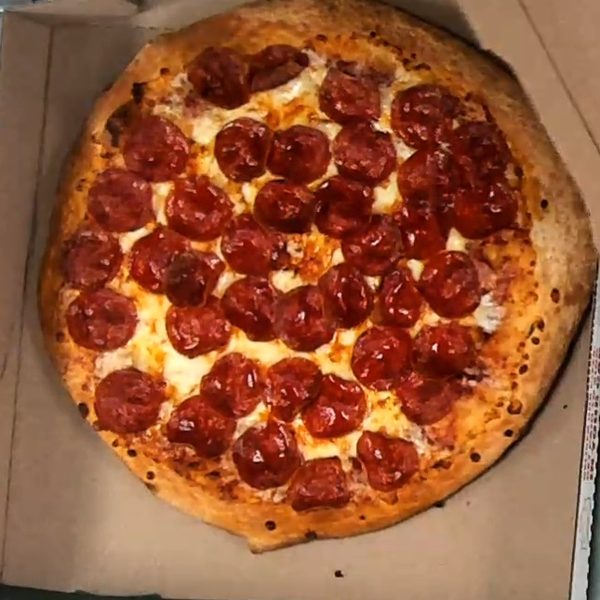
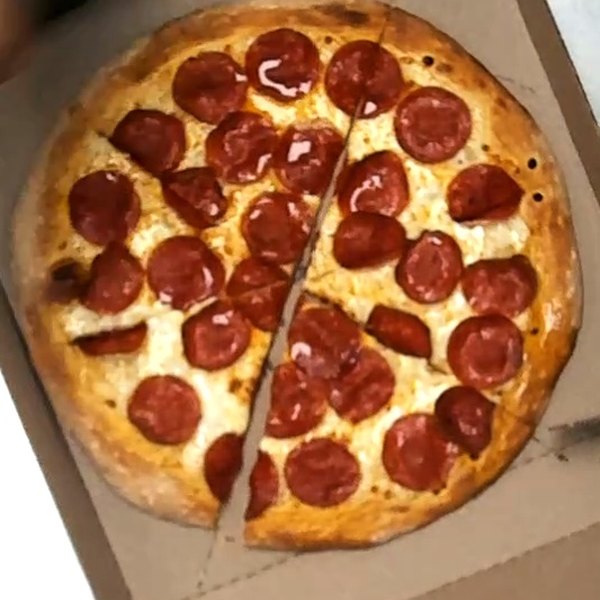 Pepperoni 9.1PassEven toppings, full bake
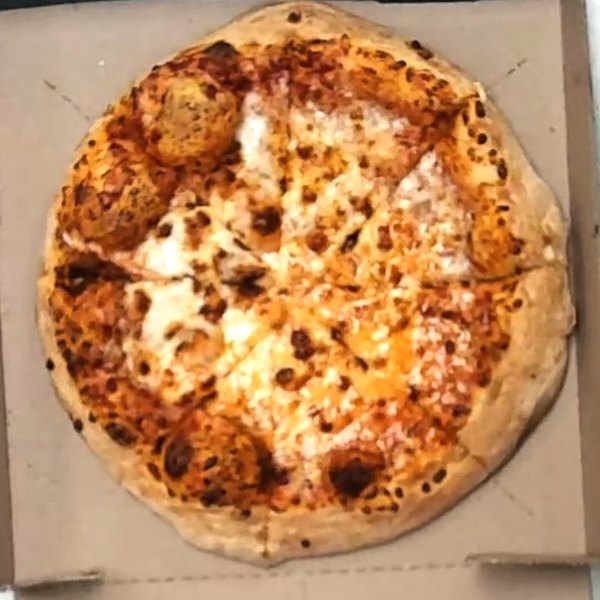
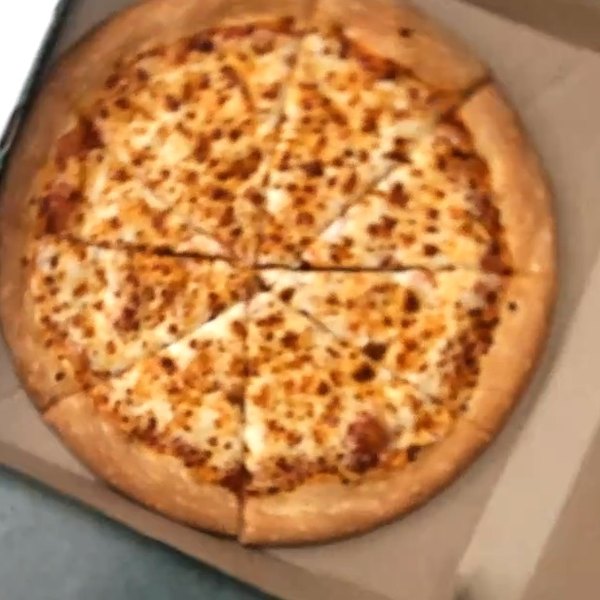
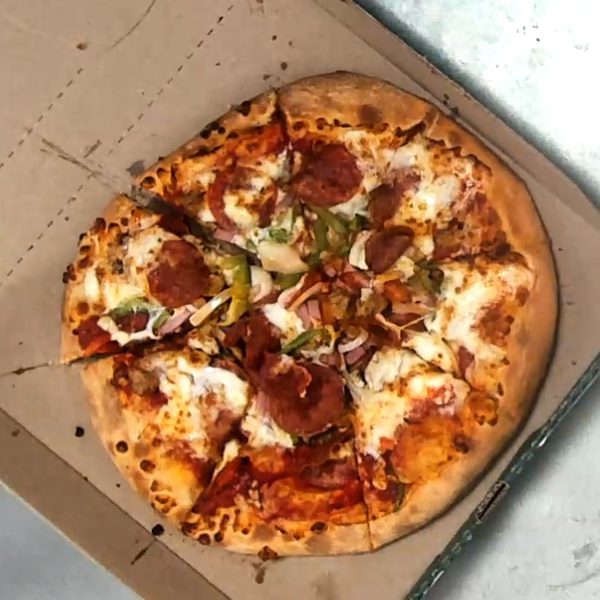 Meat 5.9FailClumped cheese
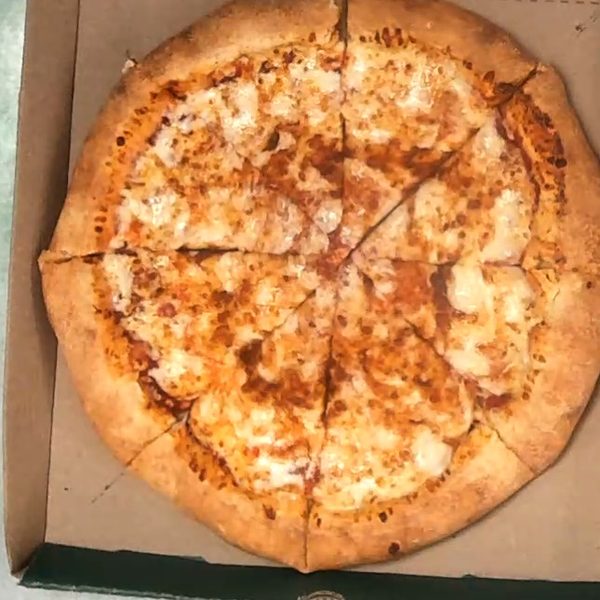
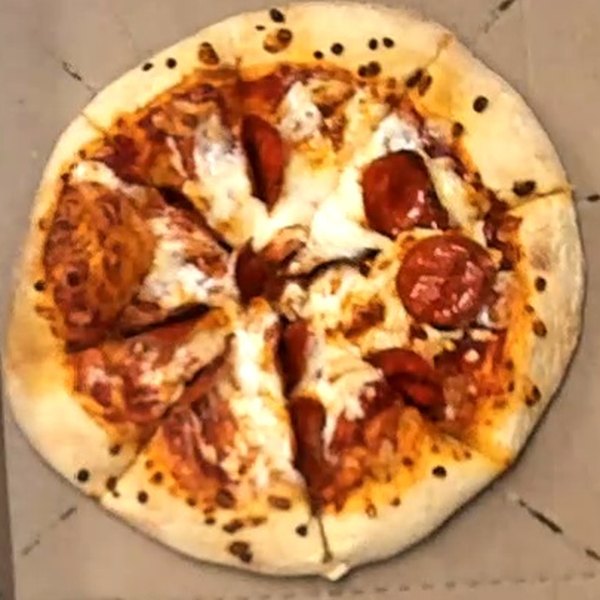
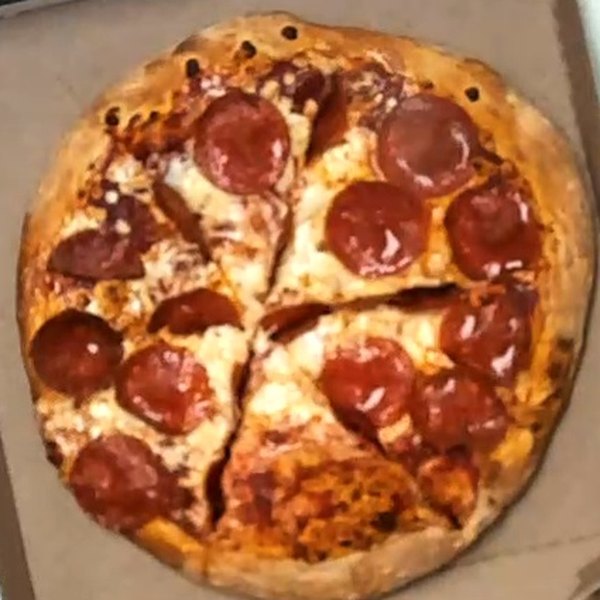 Pepperoni 6.4FailUneven topping distribution
The shift that made it sees it.
- Kwali TV Go - every store's latest pizza and score, on your phone
- Kwali TV in-store - a screen by the line: the crew's own pizzas during the shift, the best item of the week, one tip to work on, and where the store ranks
Last week'sPepperoni - Pass- 1. Maple Ave88%
- 2. Riverside84%
- 3. Downtown81%
- 9. Oakwood (You)60%
Evenly distribute correct portions of cheese across the entire designated area
- The latest item scored, so the crew sees it the same shift
- The one thing to fix this week, in plain kitchen language
- Where the store ranks on the board
- Nothing to log into on the line
Kwali TV in-store is a screen in the store, with nothing to log into. Onboarding takes 15 minutes, and the crew learns the standard from its own pizzas.
Kwali TV Go puts the same scores on your phone and on the company wall, so area managers and headquarters can check any store from anywhere.
- Maple Ave
 Riverside
 Downtown
 Hillcrestslipping
 Brookside
 Lakeview
 Midtown
 Fairfield
 Westgateslipping
 Cedar Park
 Northsideslipping
- Oakwoodneeds attention
Your rank and your misses, every morning.
Every morning the store sees where it ranks, yesterday's score by manager on duty, and the pictures of up to three misses per shift. Area managers get a visit list for the stores under the threshold.
- Where the store ranks on the board
- Yesterday's to-standard score by shift and manager on duty
- Up to three misses per shift, with the picture
- One focus area to coach
- A visit list for the stores under the threshold
Here are yesterday's results for your store.
| 1. Maple Ave | 88% |
| 2. Riverside | 84% |
| 3. Downtown | 81% |
| 9. Oakwood (You) | 45% |
For each shift, we show the "to-standard" score and up to 3 of the lowest-scoring items so you can review and coach the team.
Goal: Review the highlighted items and coach the team on the identified focus area. Focus area: Topping distribution
Follow-Up: Check your store's evolution on tomorrow's email.
Every item, every shift, every store.
One console, on your laptop or your phone. Each person sees the stores they are responsible for, nothing else.
- Kwali TV Go - every store's latest pizza and score
- Daily Feed - every item, its picture, its score, and why it missed
- Store Evolution - each store's to-standard score over time, by shift and by check
- The board - every store and region ranked against the brand average
- Downloads - weekly and monthly reports, and the pictures behind any score, ready to share
Pepperoni 9.1
Your stores have a rank. Now you can see it.
Every week: your to-standard trend, store and region ranking, your network against the brand average, and the week's best and worst item.
| 1. Maple Ave | 88% |
| 2. Riverside | 84% |
| 3. Downtown | 81% |
| 9. Oakwood - needs attention | 60% |
Your network: 78% · Brand average: 74%
The month in one view, shift by shift.
Every month: the weekly rankings, plus day shift against night shift for every store and the misses that repeat most.
| Store | Day | Night |
|---|---|---|
| Maple Ave | 90% | 85% |
| Riverside | 86% | 80% |
| Downtown | 83% | 79% |
| Oakwood | 68% | 52% |
| Uneven topping distribution | 31% |
| Low cheese near the edge | 22% |
| Dough bubbles | 14% |
| Uneven cutting | 9% |
September: 76% · August: 72% · Brand average: 74%
One score, every seat at the table.
The same score reaches the General Manager, the Director of Operations, Headquarters, Training and Quality Assurance, each with the view they need.
Your store, on the screen by the line.
Kwali TV in-store shows your crew their own pizzas during the shift. Every morning the daily email brings yesterday's score by shift, the misses with the picture, and where your store ranks. The weekly report shows your trend.
Every store you run, on your phone.
Kwali TV Go puts all your stores in one view. The daily email lists the stores under the threshold, so you know where to visit first. Store Evolution shows whether last week's coaching moved the score.
Your brand is your edge. Make it a number.
Kwali TV Go shows every store in the system. One board ranks every store and region against the standard, scored the same way everywhere, with de-identified benchmarking.
Every month, new hires learn the standard.
Crews turn over all the time, so someone new is learning the standard every month. The pizza that comes out of the oven shows how the dough thawed, how the cheese was spread and how the toppings were placed. Kwali TV in-store shows the new hire that pizza, scored against the spec.
The spec, scored at the cut table.
Eight checks, every item, your standard, in seconds. Kwali scores food, not faces.
Start with one store.
Put the camera over one cut table. If the pictures don't change how you run the shift, stop.
Start with one store